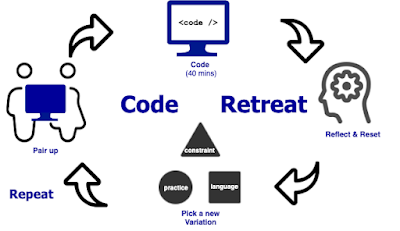
- What is CodeRetreat?
- Code Retreat
- Refactoring Coloring Book
- EPIC Rectoring Pattern
- ROI on Learning Hour
- On Being The Best
- Mob Programming vs Meetings
- CRUD Refactorings
- Connections in Mob Programming
- Getting The Best from the Mob
- The 7 Stages of Naming
- Visualizing Refactoring
What is Code Retreat?
Code Retreat
Simple explanation of what happens at a coderetreat coderetreat made with Jacqueline Lee
Refactoring Coloring Book
Simple Demo for the Refactoring Coloring Book Exercises
EPIC Rectoring Pattern
Got this from when Bryan Beecham came as part of the visiting coach program
ROI on Learning Hour
Compound Interest is fascinating: See more here (you'll have to make a copy to play with it)
On being the best
This was triggered from reading Maaret Pyhäjärvi's blog post "Thinking you are the best"I also animated this

Mob Programming vs Meetings
CRUD refactorings
This also came from Arlo Belshee's observations about refactoring code.Connections in Mob Programming
This idea came from Daniel Schildt at the bar after Maaret's & my talk about Mob Testing.Getting The Best from the Mob
This came from hearing Woody Zuill talk about mob programming while he was visiting in Helsinki, Sept 2015. I wanted to why we get better results together.
The 7 Stages of Naming
This came from Arlo Belshee's observations about refactoring legacy code. We gave a talk on how we sit and mob together extracting paragraphs at Agile2015 (August) and I wanted a clean way to show the path of better, better, good he would write on the board.
Visualizing Refactoring
While this is a visualization of Woody Zuill & my talk about practical refactoring, it came about when talking to Nancy Van Schooenderwoert about how to sum up a 2 hour talk quickly. We worked together to make this animation.


